Business Metrics: Scheduling to Real Demand
Two large customers asked for two tools to staff against demand. We built one feature that brings business data and formulas into the schedule.

The brief
Two requests, one underlying need
Randstad asked for “demand planning”. Meanwhile, another team scoped “business metrics” for Scandic, a major hotel deal.
Both landed with me. Same problem: managers wanted to staff by numbers, not gut feeling.
What I’d do differently: mocking up Randstad’s solution anchored us too early. Today I question the brief first.
Research
Bigger than two customers
Surveys and interviews showed a broad need, strongest in the UK, split between two kinds of users.
Most of our customers
Busy managers
- Small and medium businesses
- Scheduling is one of many jobs, alongside supervising and running the place
- Need it simple, quick and easy to learn
Our largest accounts
Data specialists
- Larger businesses like Scandic and Randstad
- Hired to work with data, some of them developers
- Need flexibility above everything else
What else we learned
- Businesses plan in fixed periods that rarely change.
- Comparing periods matters, for example this Christmas against last.
- Customers wanted Planday data in their calculations: revenue, costs, overtime, absence.
Designing the model
One model for two very different customers
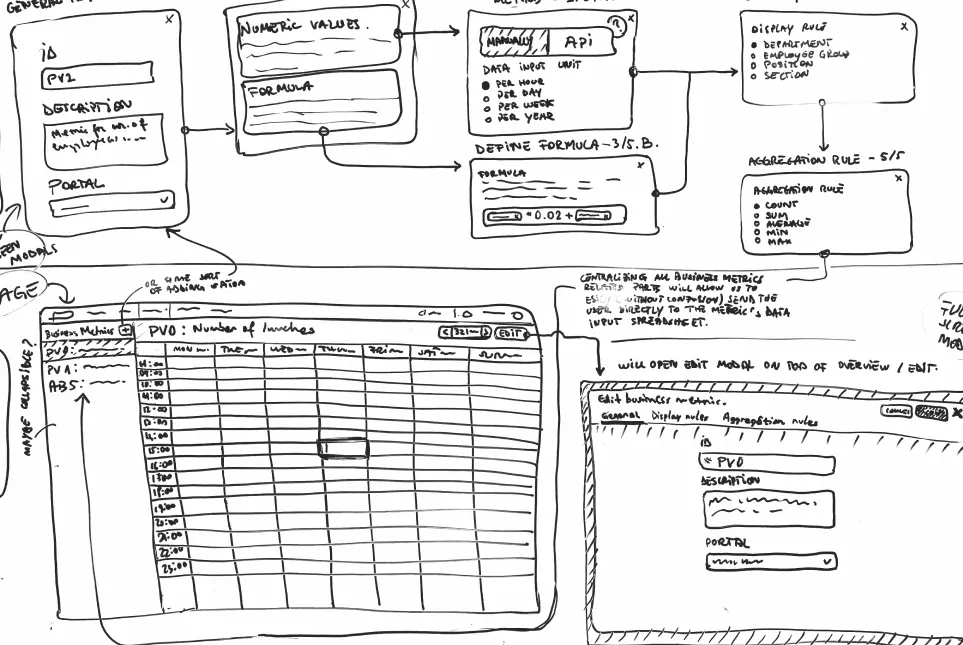
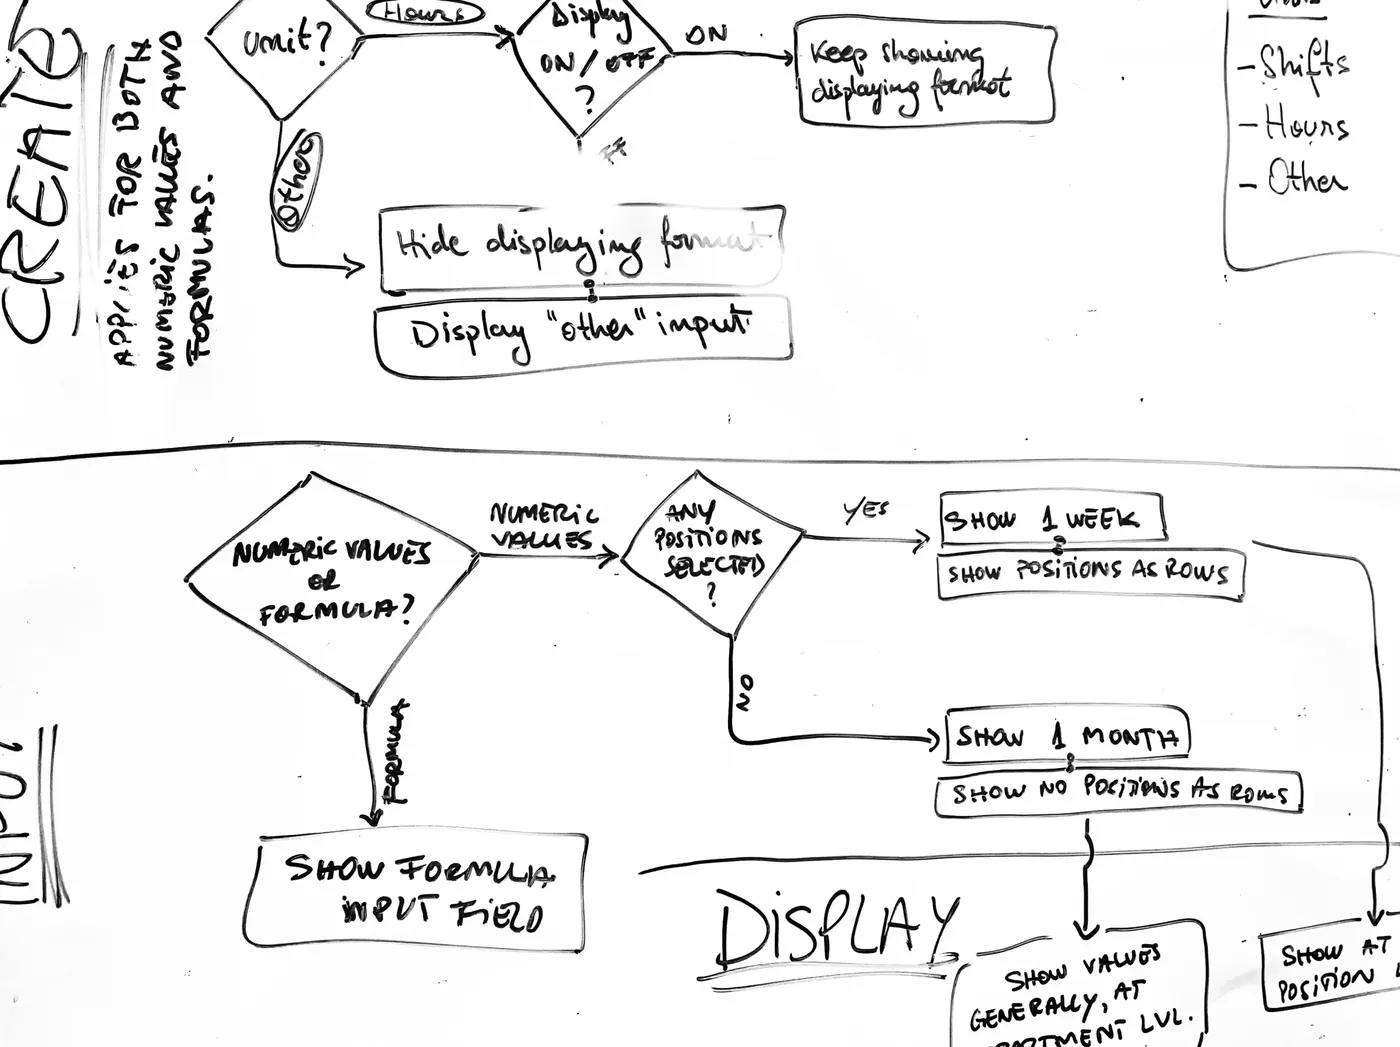
The Scandic deal had a fixed deadline. For weeks, every discipline worked the flows at one whiteboard.
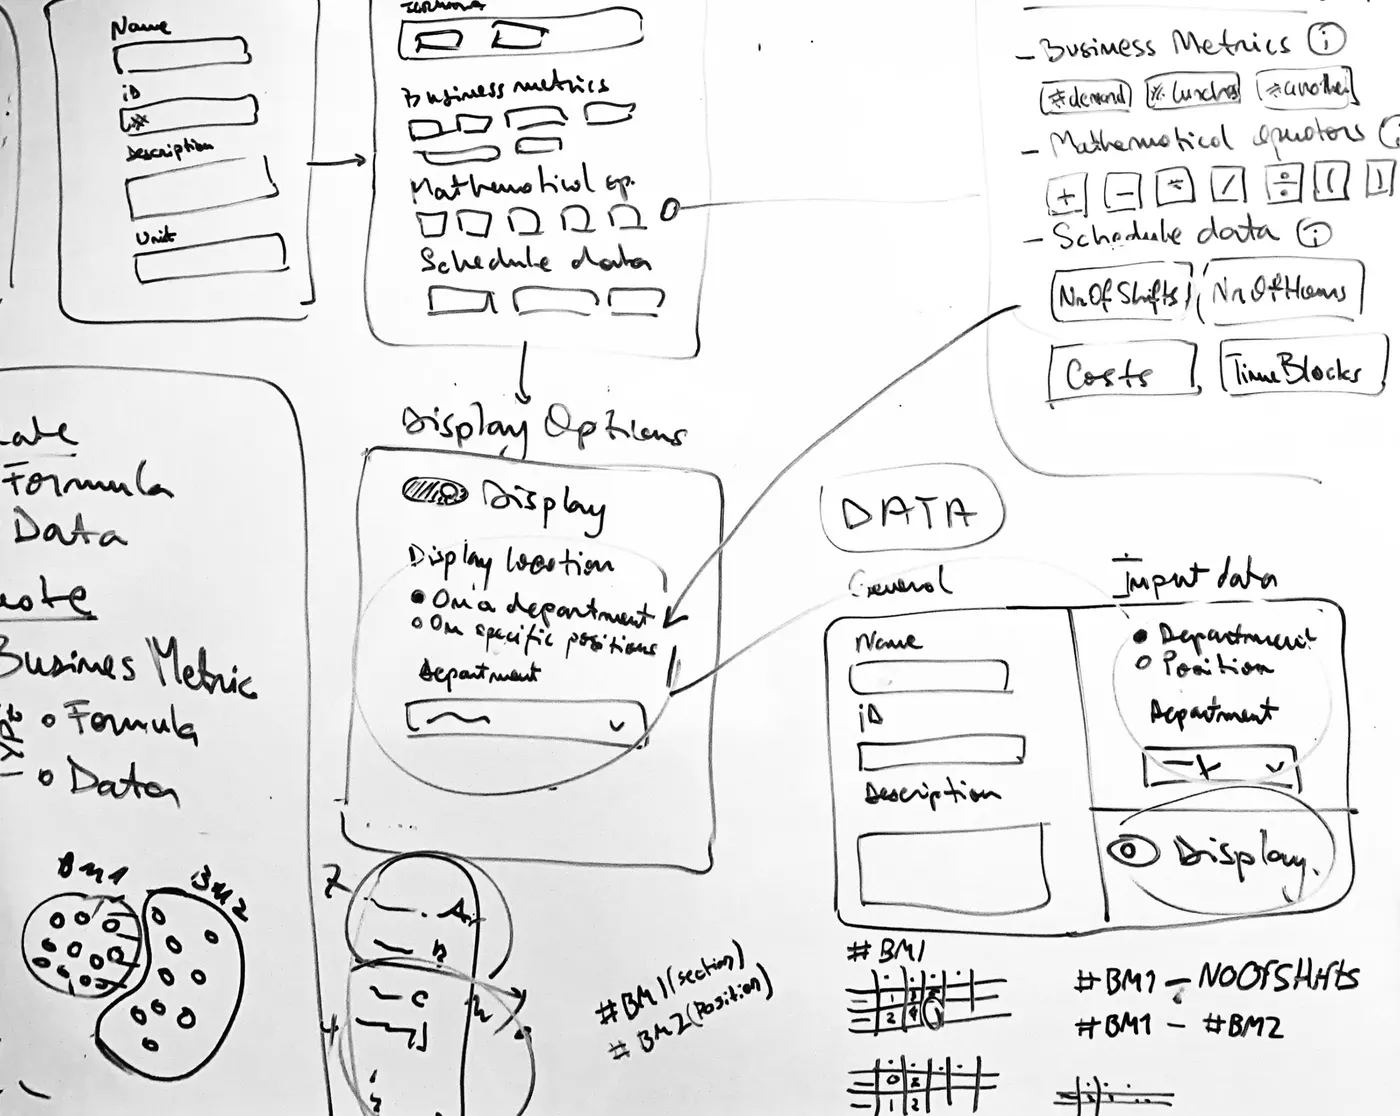
Fitting Planday’s structure
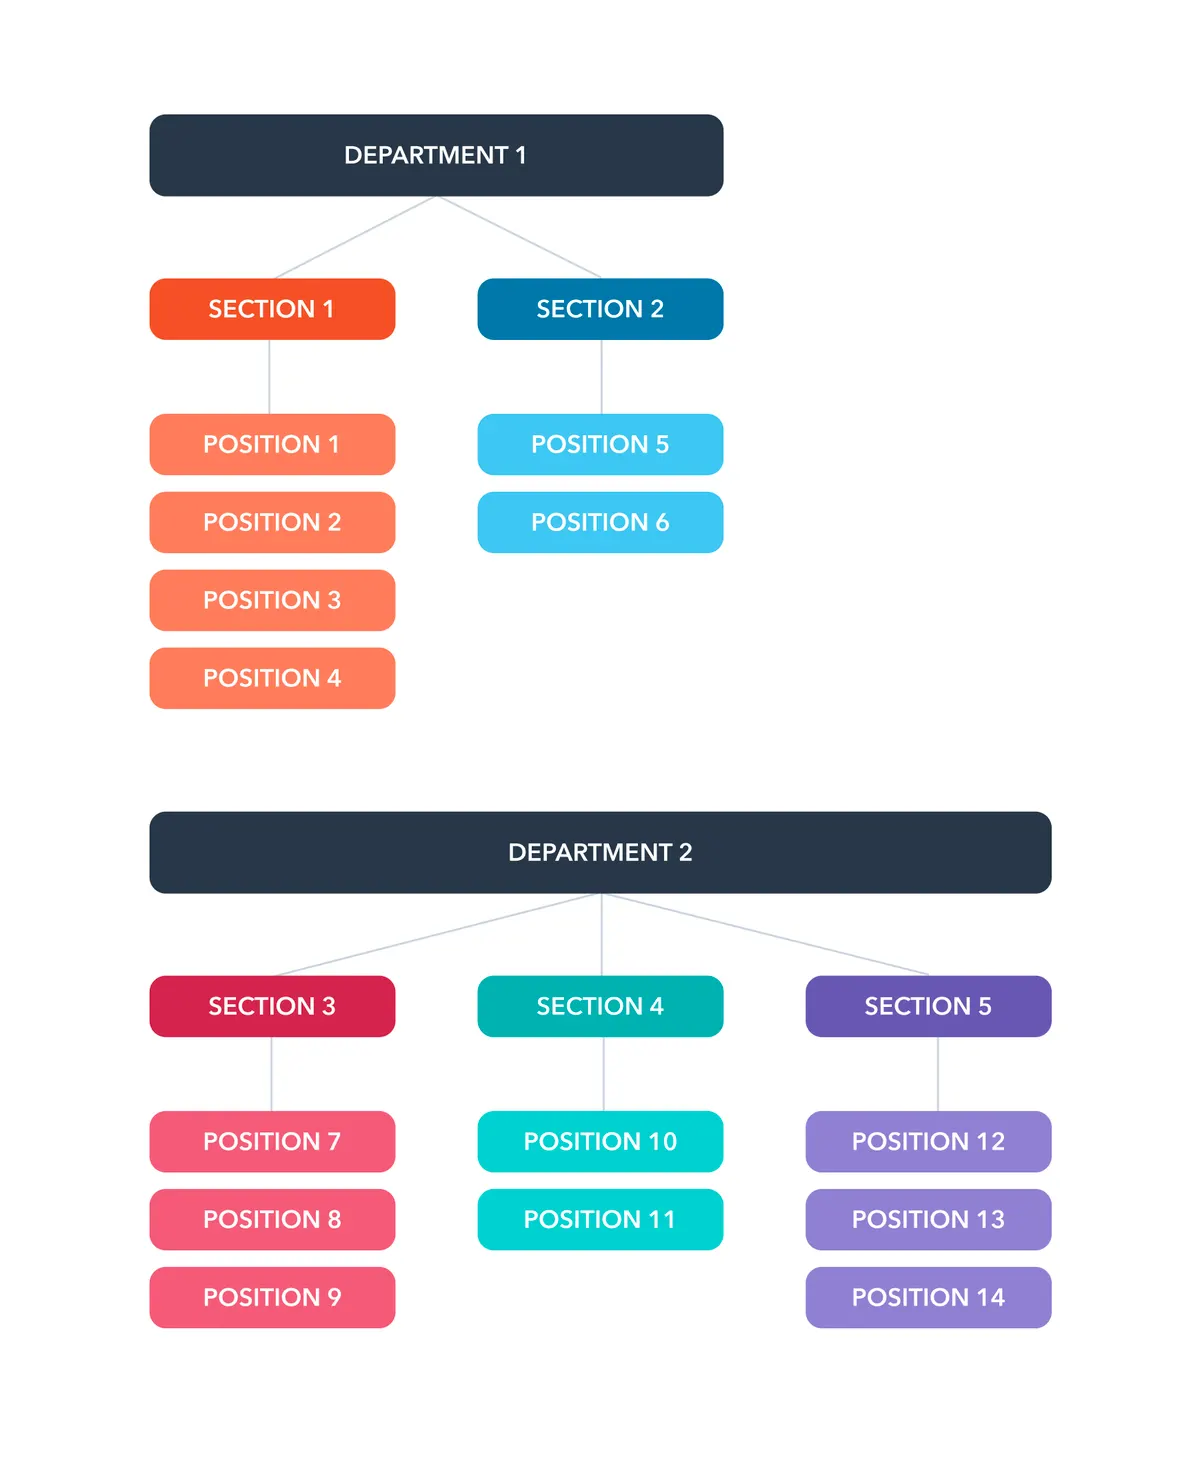
Randstad needed daily demand per position, Scandic hourly data per section, both in the existing structure.
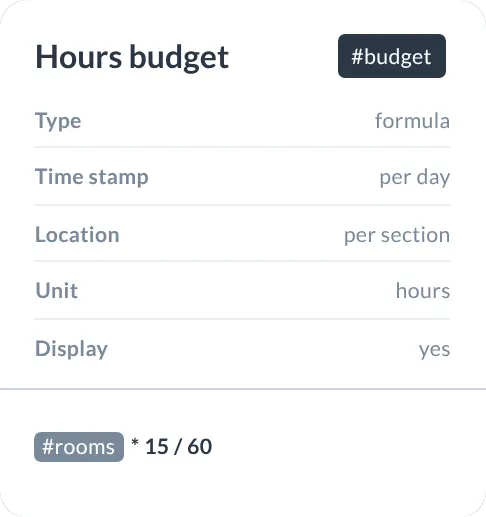
So a metric got five properties: data or formula, hourly or daily, scope, unit and visibility. Both customers’ stories tested the model.
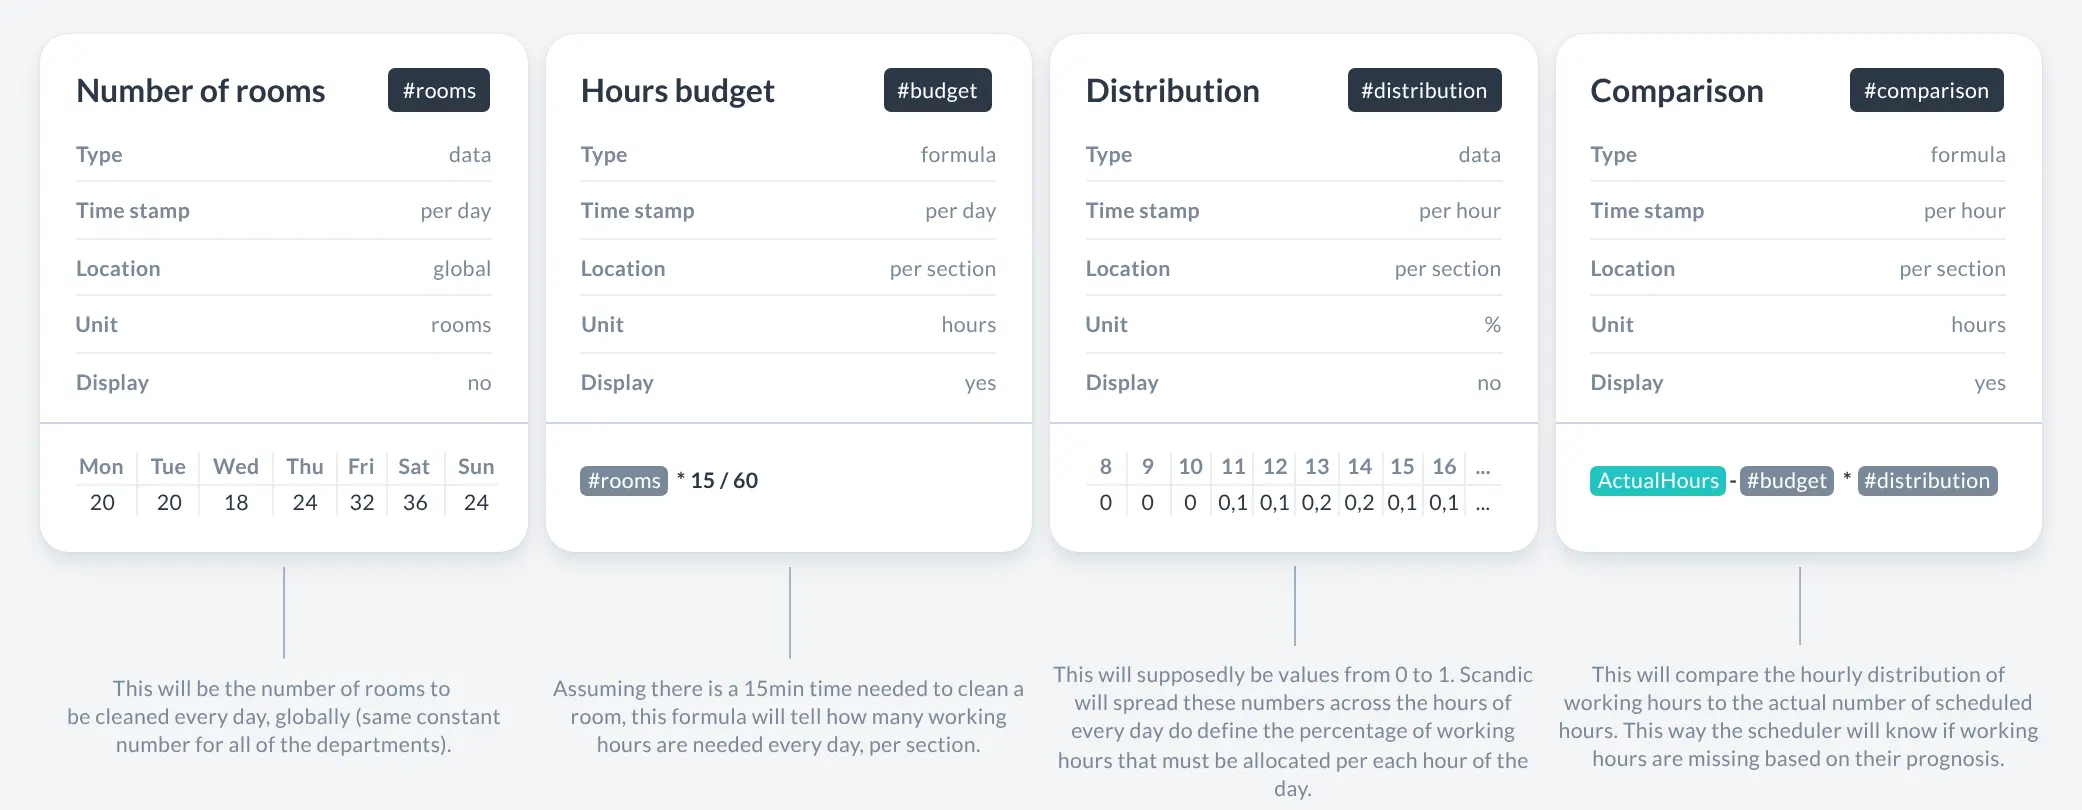
InteractiveDrag the sliders and watch where the schedule falls short.
Hourly distribution vs scheduled Needed Scheduled Short
The first release
From a number to a better schedule
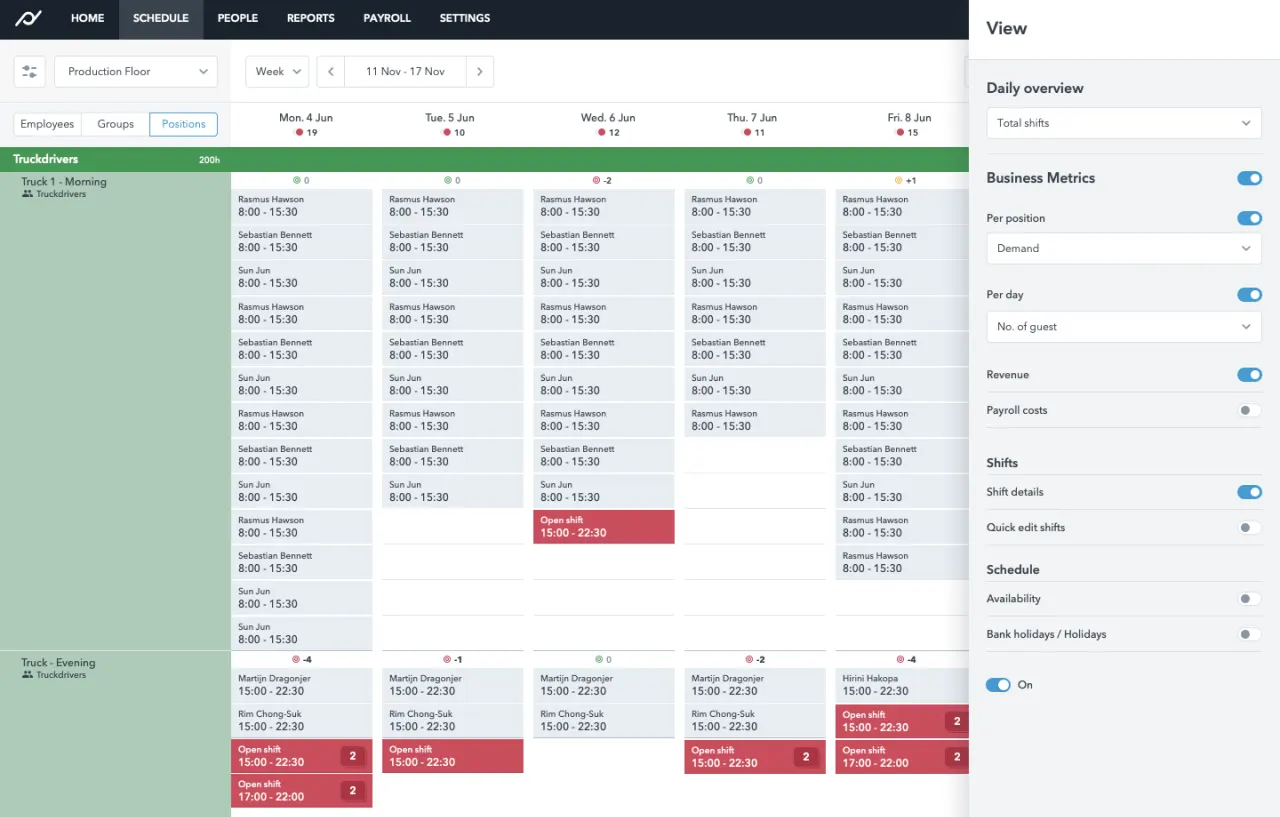
Demand shows right where shifts are planned.

Demand next to the shifts
Daily totals and hourly bars in each section header.

Hour by hour
The day view shows staffing gaps hour by hour.

Enter the numbers like a spreadsheet
Values go into a familiar spreadsheet-like grid.

Set up a metric in three steps
Name it, pick data or formula, resolution and placement.
Testing and launch
Shipped on time, with known gaps
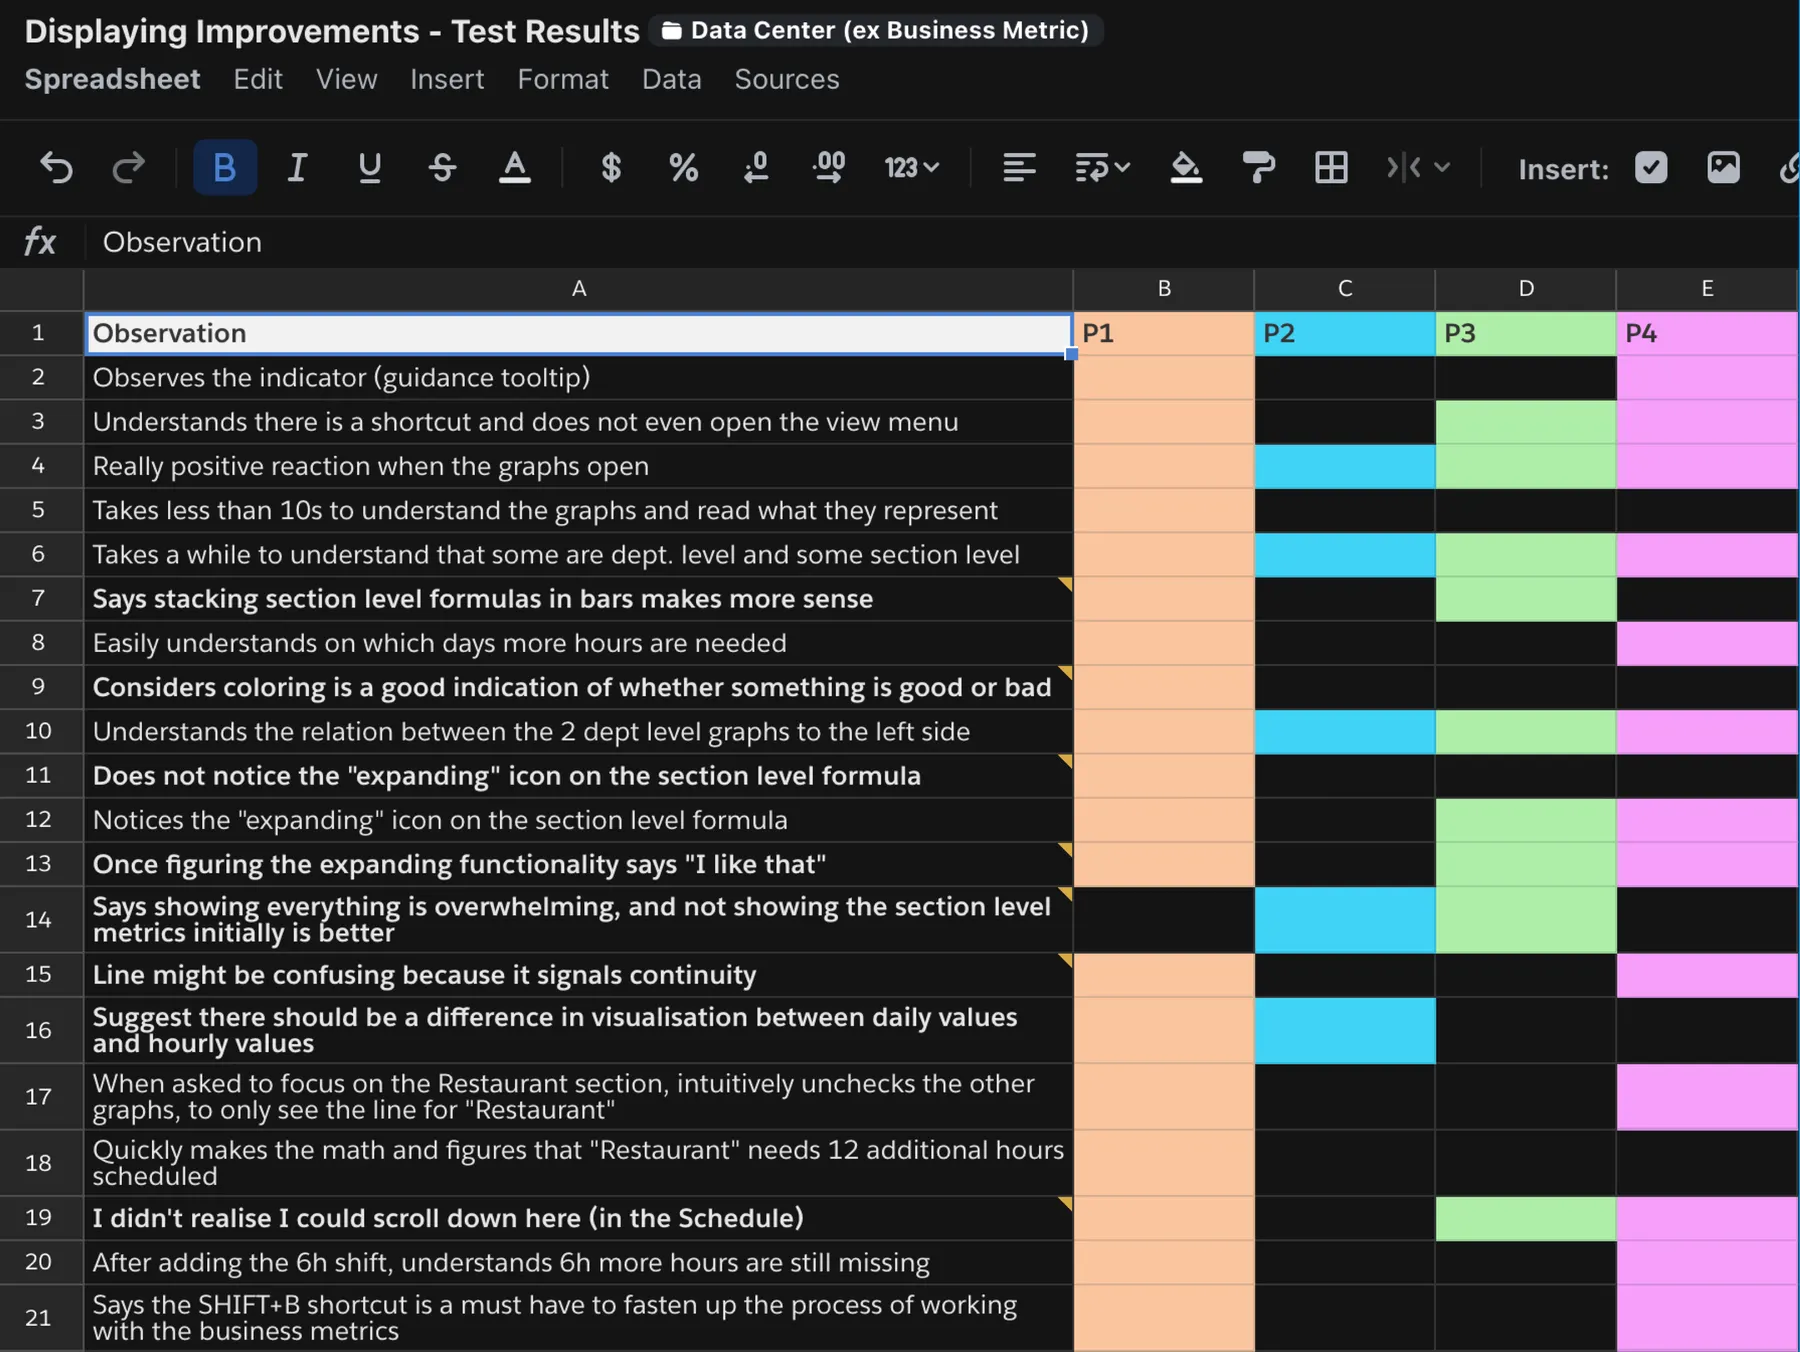
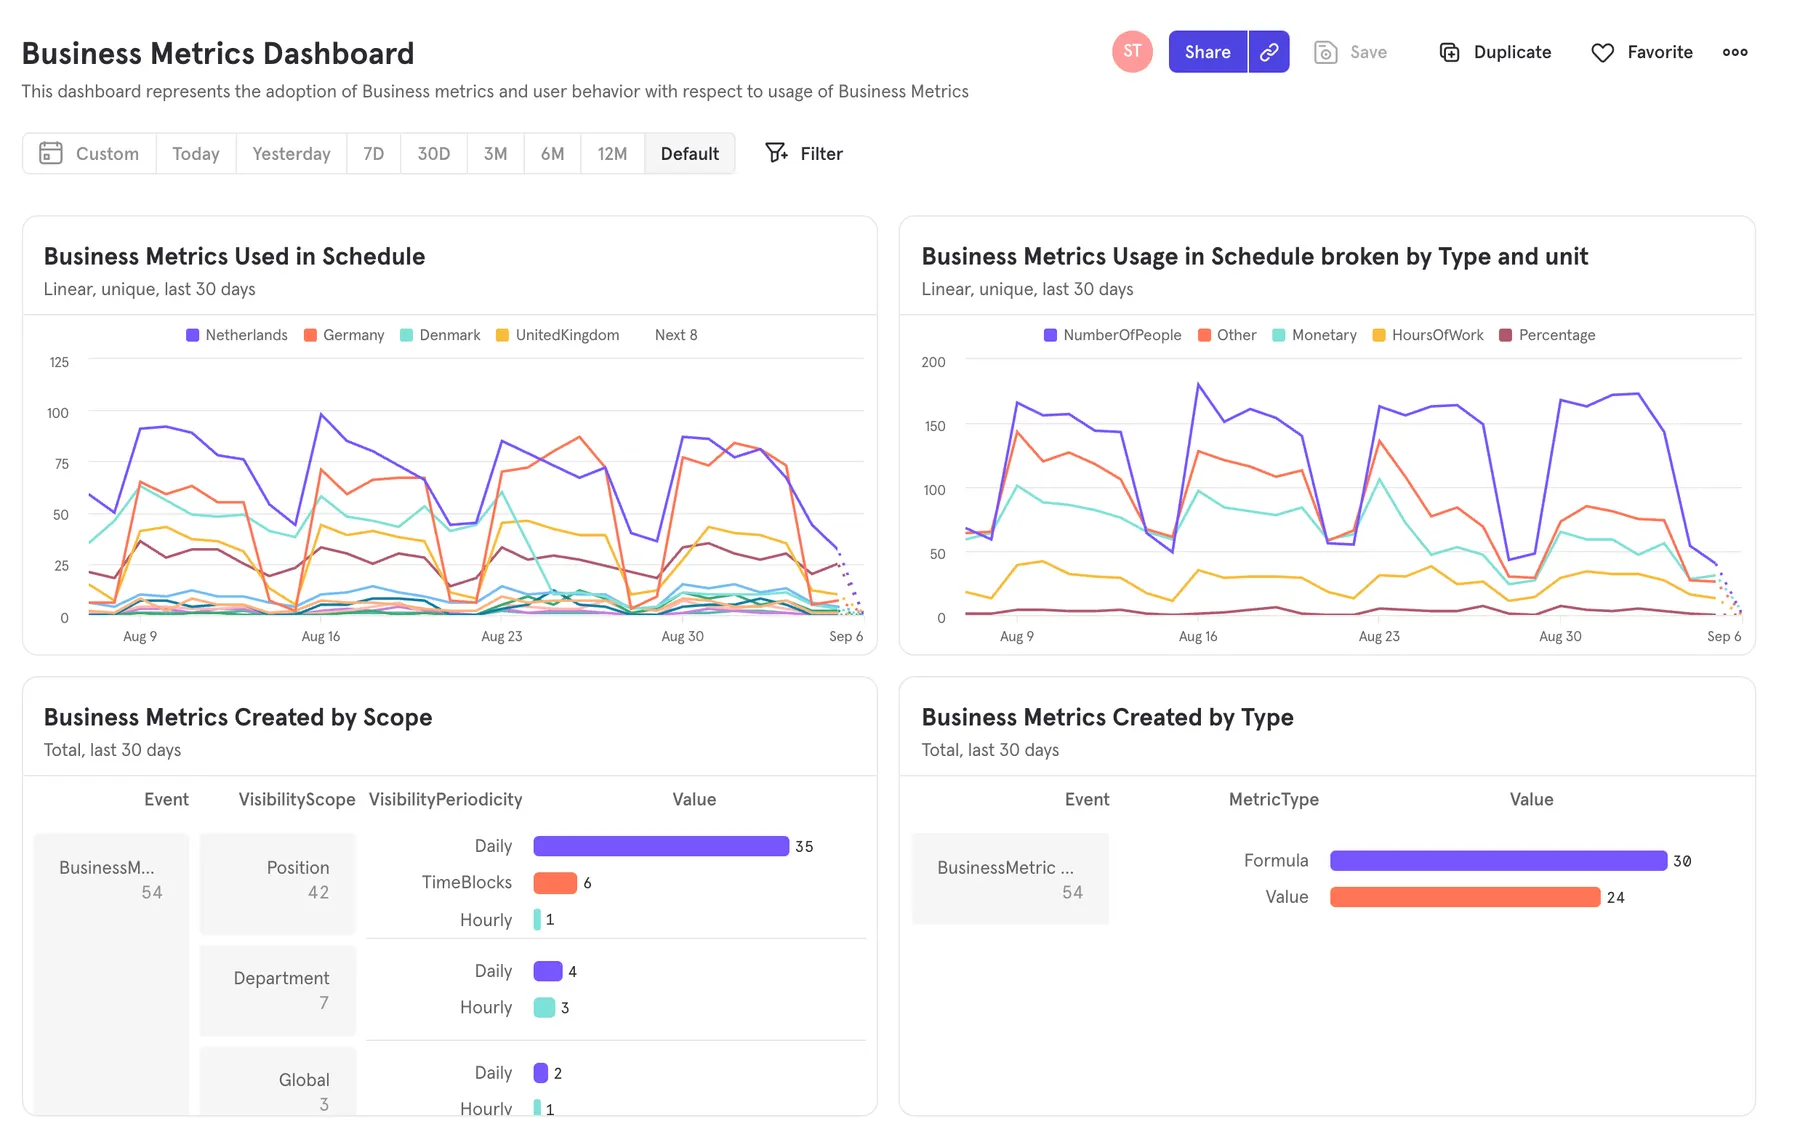
We tested the prototype, but the deadline pushed most findings to the backlog. We launched in spring 2020 and let Mixpanel set priorities.
After launch
Iterating on real usage
Usage data drove the next improvements:

Space versus numbers
We tested lighter charts, but users kept the plain numbers next to their shifts.

Hourly peaks in the week view
Hourly charts in the week view, where managers actually work.

Honest empty values
Broken formulas showed nothing. Now they show zero, as managers expected.

A formula field you can type in
Autocomplete and keyboard support for formulas.

Time blocks
Time blocks match the fixed periods customers plan in.

A simpler Data Center
Simpler setup, better accessibility, and in-product guidance.
Looking back
Powerful, but formulas are still the barrier
It grew into Planday’s Data Center. But formulas still need near-developer skills, which leaves out most managers. A colleague took on a visual formula builder next.
Next time: question the brief on day one and agree on success metrics up front.
Thanks for reading!


